
The question a workforce or location strategy team actually faces is not which country is best. It is where to place a particular set of functions given what those functions need most: scale, cost, engineering depth, regulatory proximity or language. India, Poland, the Philippines and Vietnam each answer that question differently, and a decision made on a single headline, usually cost, will put the wrong function in the wrong place.
This analysis compares the four on the dimensions that determine a placement decision, states plainly where each wins and loses, and gives a framework for matching a function to a market rather than defaulting to the largest or cheapest. It is deliberately even-handed. Each of the four is the right answer to a different question.
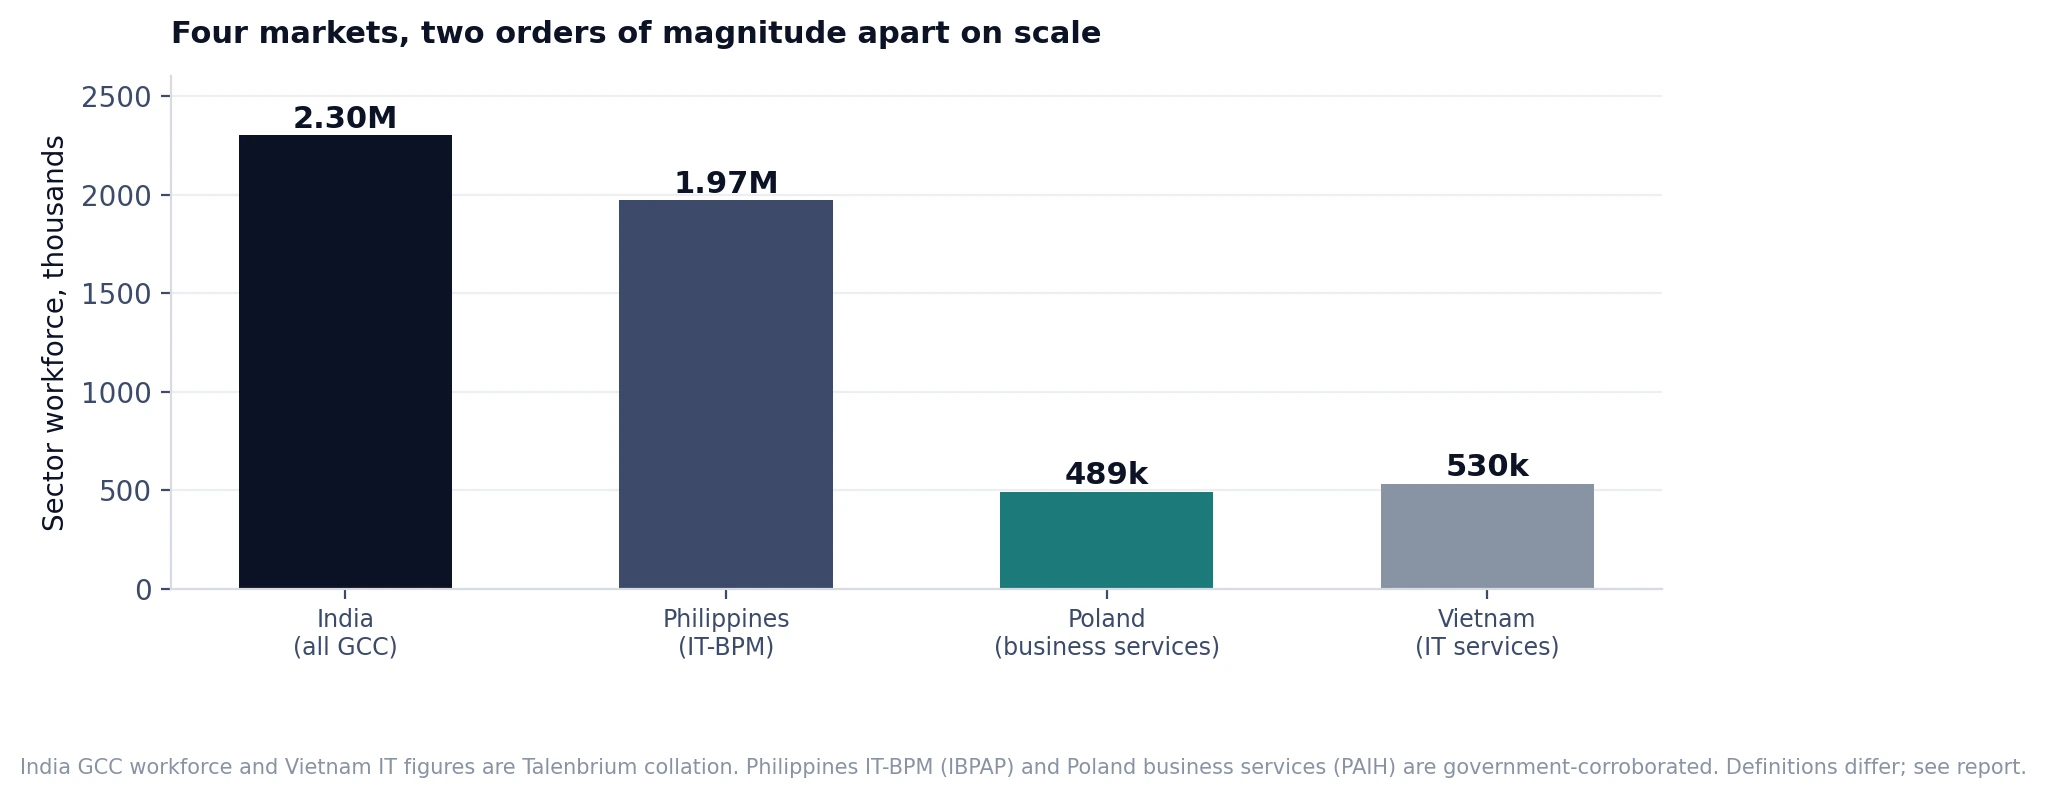
| ~2.3M India capability centre workforce, the largest by scale Talenbrium collation | 1.97M Philippines IT-BPM workforce projected for 2026 IBPAP, corroborated | ~489k Poland business services workforce, the European proximity play PAIH | Fastest Vietnam, the cost-first challenger growing quickest from a smaller base Talenbrium analysis |
Scale figures use different national definitions and are not strictly like for like. The report sets out each definition rather than implying a single comparable measure.
Two cautions apply to any comparison of these markets. The first is sourcing. Much of the granular sector data is published by industry associations and private advisory firms that this report's policy does not cite. Where a government or government-corroborated figure exists, it is used and attributed: the financial services regulator and official disclosures in India, the state investment agency and statistical office in Poland, the industry association figures that the government news agency has corroborated in the Philippines, and government investment and technology data in Vietnam. Everything comparative, the scoring, cost indices, attrition and pay, is Talenbrium's analysis and is labelled as such.
The second caution is comparability. The four markets count their sectors differently. India's figure is the whole capability centre workforce across all industries. The Philippines figure is the IT-BPM sector, which is broader than capability centres alone. Poland's is the business services sector. Vietnam's is narrower still. This report does not pretend these are one measure. It compares the markets on the dimensions that matter for a decision rather than on a single misleading headcount, and it states each definition where it uses one.
Source: Talenbrium analysis
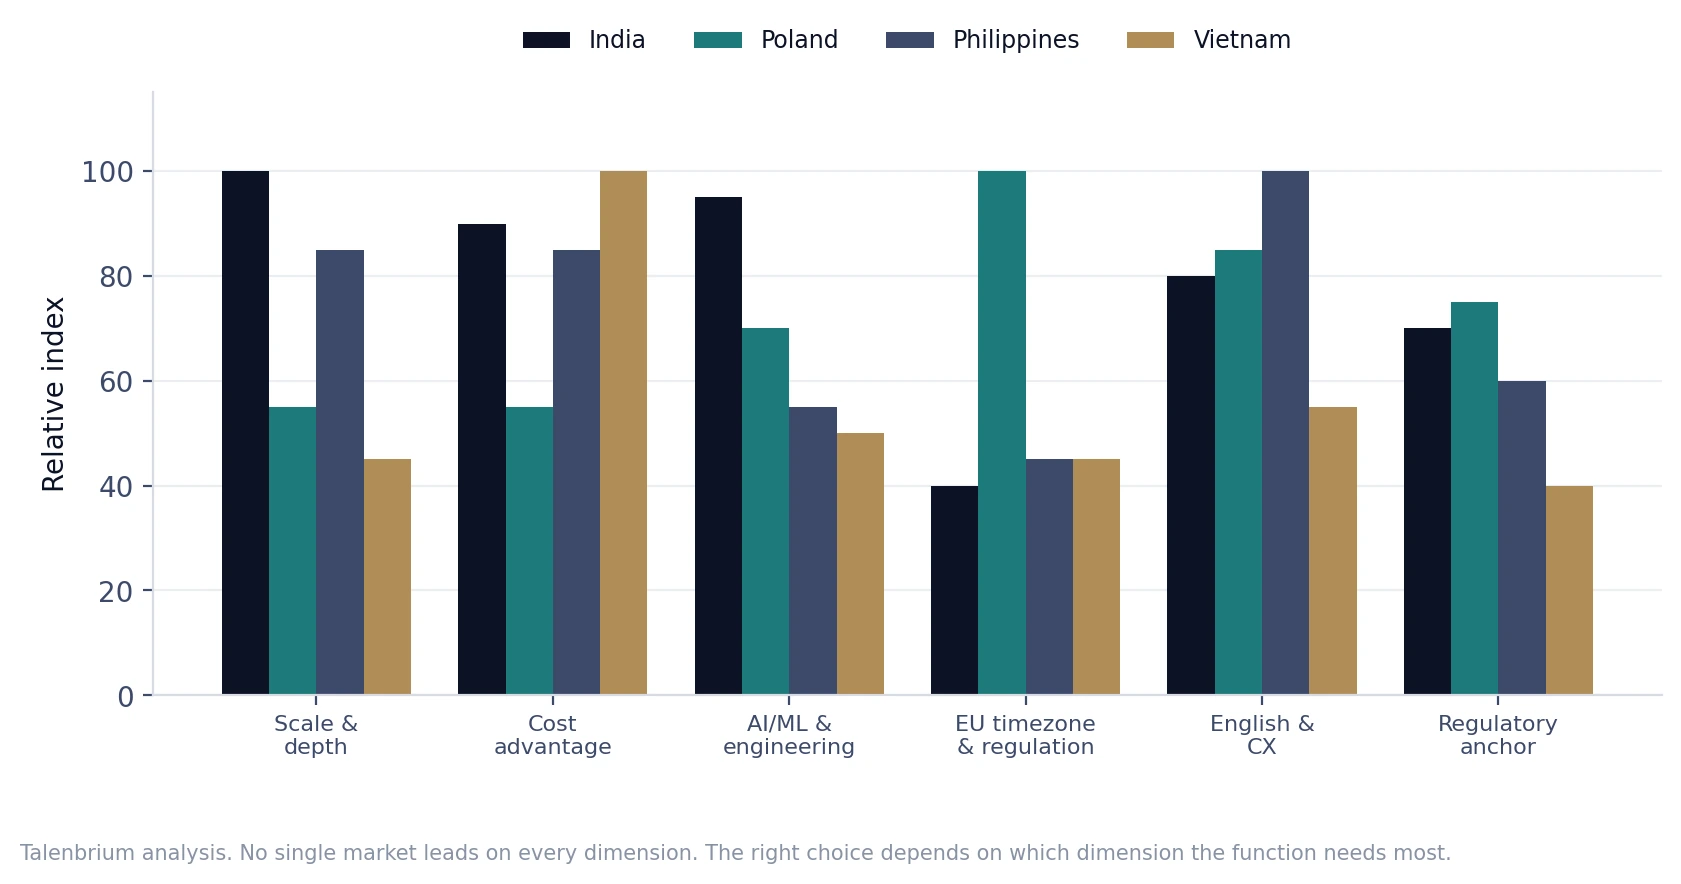
A placement decision turns on six things, and no market leads on all of them.
Scale and depth is the size and maturity of the talent pool. India leads decisively. Cost advantage is the fully loaded cost of equivalent capability. Vietnam leads, with the Philippines and Poland's regional cities close. AI, machine learning and engineering depth is the availability of advanced technical talent. India leads, with Poland strong in specialised European-facing work. European time zone and regulatory proximity is the ability to serve European clients under European rules in European hours. Poland leads decisively and the others cannot easily match it. English and customer experience is the strength of English-language, client-facing delivery. The Philippines leads on customer experience specifically. Regulatory anchor is whether the market offers a genuine, stable regulatory framework for financial services work. India's GIFT City and Poland's European Union membership lead.
| India for scale and engineering. Poland for European proximity and regulation. The Philippines for English and customer experience. Vietnam for cost. The decision is which of these the function needs most. Talenbrium Workforce Intelligence, Q3 2026 |
Source: Talenbrium collation; Philippines and Poland figures government-corroborated
India is the default for scale and for advanced technical work. Its capability centre workforce is heading toward 2.3 million, it has the deepest artificial intelligence and engineering pool of the four, and its centres increasingly own product, risk and quantitative work rather than executing it. For BFSI specifically, GIFT City provides a genuine regulatory anchor, treated as offshore for tax while sitting inside India for talent. The costs against India are attrition of 15 to 18 percent in the primary hubs and rising senior pay. It is the right choice when the function needs scale, engineering depth or AI, and the wrong choice when it needs European regulatory proximity.
Poland is the answer when the function has to serve European clients under European rules in European hours. Its workforce already operates inside the European regulatory world, it offers unusual language breadth, and it carries deep specialised financial and technology talent in Krakow, Warsaw and Wroclaw. It does not compete on cost with the Asian markets and does not try to. The cost against Poland is exactly that: it is the most expensive of the four. It is the right choice for European-facing regulatory, risk and resilience work, and the wrong choice for cost-driven volume.
The Philippines is the established leader in English-language, client-facing delivery and customer experience, with a workforce approaching two million and growth that has outpaced the global average for over a decade. It is moving up the value chain into capability-centre and analytics work, backed by government digital-city and incentive frameworks. Its depth in advanced engineering and AI is thinner than India's, and it is the right choice when the function is customer-facing, English-centric or experience-led, and a weaker choice for deep quantitative or engineering work.
Vietnam is the cost-first challenger, growing quickly from a smaller base, strongest in software and IT delivery. It offers the lowest fully loaded cost of the four and a young, expanding technical workforce, backed by government technology investment. Its scale, English breadth and regulatory maturity for financial services are behind the other three. It is the right choice for cost-sensitive software and IT delivery and a forward bet, and the wrong choice for regulated financial services work that needs an established framework today.
The report's central tool is a placement framework that maps common capability-centre functions to the market that fits each best, with the second-best alternative and the reason. The table below is the format example. The full report covers the complete function set across all four markets with a fit score and rationale for each.
| Function | Best fit | Alternative | Why |
|---|---|---|---|
| AI and ML engineering | India | Poland | Deepest AI pool and scale; Poland for European-facing models. |
| European regulatory reporting | Poland | India (GIFT) | European rules, hours and language; GIFT City if scale dominates. |
| Customer experience and support | Philippines | India | Strongest English customer experience delivery. |
| Cost-sensitive software delivery | Vietnam | Philippines | Lowest loaded cost; Philippines for English-facing work. |
| Quantitative risk and analytics | India | Poland | Deepest quantitative pool; Poland for European risk frameworks. |
| Operational resilience and DORA | Poland | India (GIFT) | European regulation native to the Polish workforce. |
Format example. The full report scores the complete function set across all four markets with a fit rationale for each.
Source: Talenbrium analysis
The framework also handles the hybrid case, which is the realistic one for most large employers. Few place everything in one market. The common pattern is engineering and AI in India, European regulatory work in Poland, customer experience in the Philippines, and cost-sensitive delivery in Vietnam, and the report models the coordination cost of that distribution against the capability gain, so the decision is made on total value rather than on any single market's headline.
The report turns the four-market comparison into a defensible placement decision for a specific set of functions.
| SIX-DIMENSION COMPARISON India, Poland, the Philippines and Vietnam scored on scale, cost, engineering, regulation, language and regulatory anchor. | FUNCTION-TO-MARKET FRAMEWORK The complete capability-centre function set mapped to best-fit and alternative markets with a rationale for each. |
| COST COMPARISON MODEL Fully loaded cost of equivalent capability across the four, beyond headline wage. | ATTRITION AND RETENTION VIEW How turnover differs across the four markets and what it does to real cost. |
| REGULATORY COMPARISON The regulatory framework for financial services work in each market, including GIFT City and European Union proximity. | HYBRID DISTRIBUTION MODEL The coordination cost of splitting functions across markets, set against the capability gain. |
| SCALE AND DEFINITION GUIDE What each market's headline workforce figure actually counts, so the comparison is honest. | FORWARD VIEW Wage convergence, regulatory change and the trajectory of each market over the planning horizon. |
| EDITABLE DATA TABLES Every exhibit supplied as an Excel workbook. 10 hours of customisation included. | COMPANION REPORTS Single-market depth available for India and Poland as standalone workforce planning reports. |
| MARKETS IN SCOPE India, Poland, the Philippines and Vietnam, compared for BFSI and shared services capability centre placement. | DECISION SUPPORTED Where to place a new capability centre, or how to distribute functions across markets. |
| DIMENSIONS COMPARED Scale and depth, cost, AI and engineering, European timezone and regulation, English and customer experience, regulatory anchor. | DATA PERIOD Q3 2026 snapshot. Trend series 2020 to Q1 2026. |
| PRIMARY RESEARCH Talenbrium posting intelligence, Talenbrium compensation model and Talenbrium analysis. | SECONDARY VALIDATION IFSCA and GIFT City (India), PAIH, GUS and Eurostat (Poland), IBPAP figures corroborated by the government news agency and Digital Cities and CREATE frameworks (Philippines), and Vietnamese government technology and investment data. |
| STATED DATA GAPS The four markets count their sectors differently and no single comparable workforce measure exists. Comparative scoring, cost and attrition are Talenbrium analysis, labelled throughout. | SOURCING POLICY Government and intergovernmental bodies are cited by name. Industry associations, private advisory firms and named companies are not named anywhere in this report. |
| CUSTOMISATION 10 hours free customisation included. Additional markets and function-specific deep dives available. | DELIVERY Within 2 to 4 business days of purchase. Report plus editable data tables. |

Customise the study to your target geography, role, skill cluster, or benchmark set, or request a sample before you proceed.