
Research CatalogueThematicGender Pay Gap Benchmarking Report, 2026
Research Report0000-00-0052 pages

Gender Pay Gap Benchmarking Report, 2026

Talenbrium Research  |  0000-00-00  |  By Diptanjan Biswas  |  Talenbrium Proprietary Intelligence
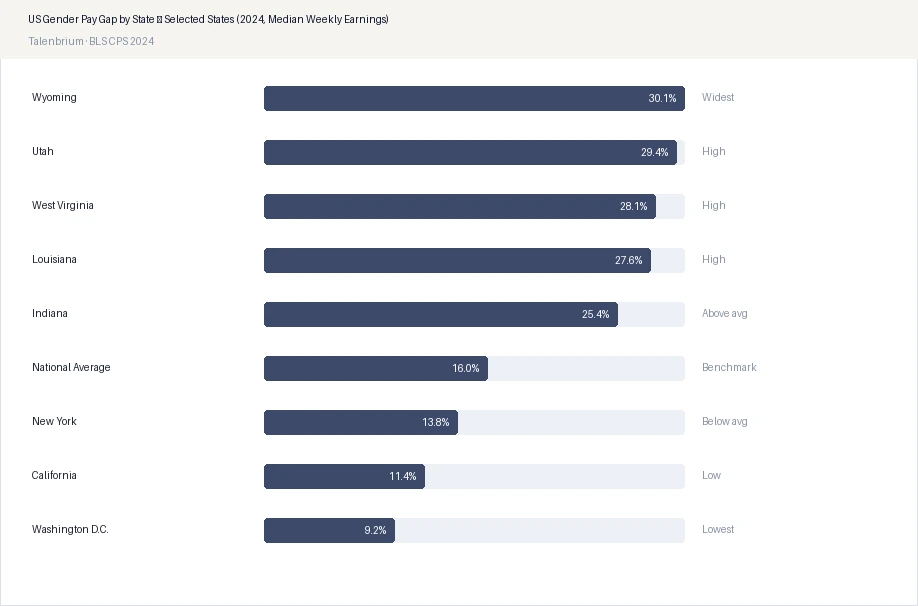
16.0% national US gap — but a 21-point range from Wyoming (30.1%) to Washington D.C. (9.2%).

Talenbrium's compensation benchmarking model — drawing on salary disclosures across 2.4 million+ job postings calibrated against BLS Current Population Survey data — puts the US national gender pay gap at 16.0% on a median weekly earnings basis in 2024. That aggregate figure conceals a 21-percentage-point range from the most to least equitable states. Wyoming records a 30.1% gap. Washington D.C. records 9.2%. Talenbrium's state-level analysis maps this variation against industry composition, pay transparency legislation status, and union density — three factors that together explain the majority of cross-state variation.

Pay transparency laws covering an estimated 40% of the US workforce — California, Colorado, New York, Washington, Illinois, Massachusetts — are making compensation data visible in ways that make unjustified pay disparities commercially costly even without direct enforcement action. In Europe, the EU Pay Transparency Directive's June 2026 implementation deadline is creating parallel urgency. Talenbrium's European employer postings analysis identified a 34% year-on-year increase in Compensation Equity Analyst postings across the EU in 2025.
16.0%
US national gender pay gap — median weekly earnings basis, 2024
Talenbrium · BLS CPS 2024 validation
28.4%
US financial services gender pay gap — largest sector gap
Talenbrium sector compensation model 2025
42%
US HR respondents citing pay equity audit as top-3 compliance priority 2026
Talenbrium Q1 2026 Pulse Survey
34%
YoY increase in Compensation Equity Analyst postings, EU, 2025
Talenbrium EU postings engine
US Gender Pay Gap by State — Selected States (2024, Median Weekly Earnings)
16.0% national US gap — but a 21-point range from Wyoming (30.1%) to Washington D.C. (9.2%).Talenbrium's compensation benchmarking model — drawing on salary disclosures across 2.4 million+ job postings calibrated against BLS Current Population Survey data — puts the US national gender pay gap at 16.0% on a median weekly earnings basis in 2024. That aggregate figure conceals a 21-percentage-point range from the most to least equitable states. Wyoming records a 30.1% gap. Washington D.C. records 9.2%. Talenbrium's...
Full data available to purchasers
Financial services carries the widest gap — driven by role concentration, not like-for-like discrimination

Talenbrium's industry-level compensation benchmarking identifies financial services as the sector with the widest gender pay gap in both the US and EU. At 28.4% in the US, the gap is driven primarily by male concentration in the highest-earning asset management, investment banking, and private equity roles rather than like-for-like base salary differences. The CIPD's Pay Report 2025, which Talenbrium uses as a UK validation benchmark, finds that organisations with smaller gender pay gaps report higher female employee engagement scores and lower voluntary attrition among women — providing the business case alongside the compliance case.
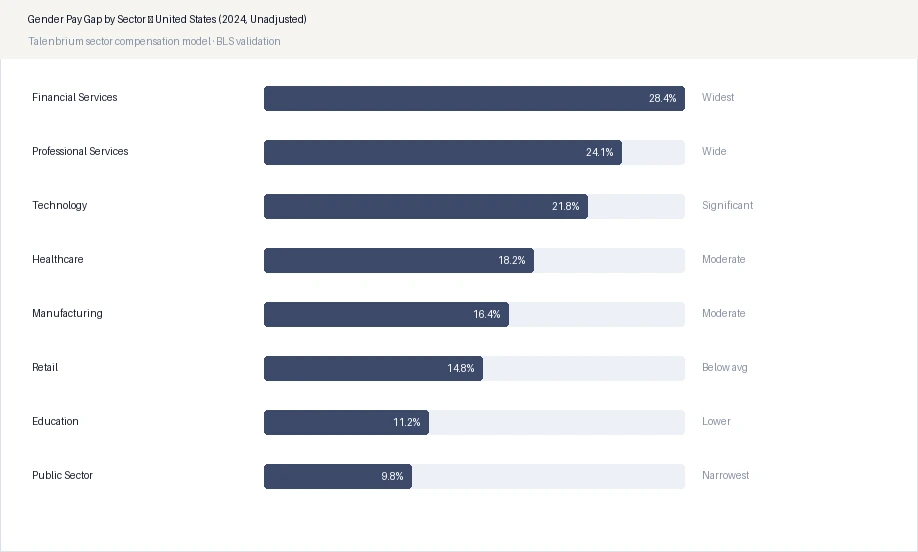

Gender Pay Gap by Sector — United States (2024, Unadjusted)
"Pay equity audit completion was cited by 42% of US HR respondents as a top-three compliance priority for 2026, up from 29% in Q1 2025 — the steepest single-year increase of any compliance category in Talenbrium's survey history." — Talenbrium Q1 2026 Workforce Pulse Survey
The full 52-page report delivers: all 50 US state pay gap data (unadjusted and controlled); all 27 EU member states plus UK; occupational level analysis (C-suite through clerical); pay quartile distribution by gender across all covered geographies; controlled (like-for-like) gap analysis by sector and occupation; compensation equity analyst hiring trend data by country; and strategic remediation pathway analysis. All sub-sector and occupation-level compensation data is gated.
Full data available to purchasers
Table of Contents
01Executive Summary & Global BenchmarksPreview
02US National Analysis: 16.0% Gap — Drivers and VariationPreview
03US State-by-State Analysis: All 50 StatesGated
04US Sector Analysis: All IndustriesGated
05US Occupational Level Analysis: C-Suite to ClericalGated
06Pay Transparency Legislation Impact: State-Level AnalysisGated
07EU Gender Pay Gap: 27 Member StatesGated
08EU Sector Analysis: Financial Services, Technology, HealthcareGated
09UK Analysis: ONS ASHE and Government Equalities Office DataGated
10Controlled vs Unadjusted Gap: Methodology and FindingsGated
11Compliance Readiness: Pay Audit Programme DesignGated
12Strategic RecommendationsPreview
13MethodologyPreview
Report scope
Series & Price
Series A · Report 5 · USD 3,499 · 52 pages
Geography
US — all 50 states + DC · EU — all 27 Member States · UK
Metrics
Unadjusted gap · Adjusted (like-for-like) gap · Pay quartile distribution · C-suite differential
Occupational levels
C-suite · Senior management · Middle management · Professional/technical · Clerical
Primary research
Talenbrium Q1 2026 Pulse Survey · n=284 · pay equity audit module
Secondary validation
BLS CPS 2024 · Eurostat SES 2024 · ONS ASHE 2025 · CIPD Pay Report 2025
Customisation
10 hours free customisation & expert consultation included
Delivery
Within 24 hours of purchase
Assigned Author
Diptanjan Biswas

Diptanjan Biswas

Principal Head, Strategic Consulting

Diptanjan Biswas leads strategic consulting at Talenbrium, bringing nine years of experience across research, risk, and workforce intelligence in banking, technology, and advisory sectors.

Workforce Strategy Labour Market Intelligence Credit Risk Recoveries Strategy
View Full Author Profile Linked to Talenbrium's public author library

Ready to access the full intelligence?

Purchase directly, or speak with our team to discuss your requirements first.

Purchase
Buy this report — USD 3,499
Enquire
Speak with our research team
Custom
Commission a bespoke engagement
Home Reports Insights Contact