
Every sector is buying AI, and the buying has outrun the workforce. Postings for AI and machine-learning roles have risen sharply, but the qualified pool has not kept pace. Independent estimates put global AI demand at more than three open roles for every qualified candidate, and the average AI role now takes close to five months to fill. The constraint is not budget or model access. It is people who can build, train and ship models in production.
This report treats the roles as the unit of analysis. It profiles each designation, sets demand against supply, benchmarks pay across the United States, Germany and the United Kingdom, shows where the openings concentrate, and names the employers hiring the most.
AI is not one job. Ten designations carry the work, and the centre of gravity has moved to the roles that build generative and agentic systems. They split into three forward-facing layers: the GenAI and agentic engineers who build the newest systems, the platform and production roles that run them, and the research and product roles around them. Demand, pay and supply differ sharply across them.
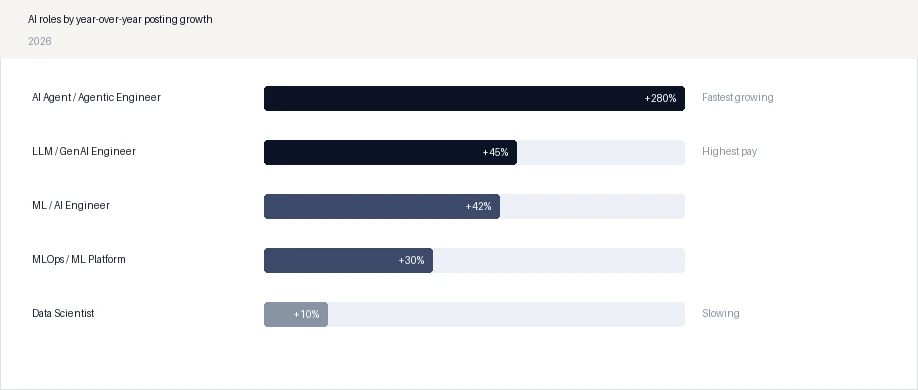
The fastest-growing part of AI hiring is agentic engineering. Postings for AI agent and agentic roles rose sharply through 2026 as companies moved from single-model pilots to systems that plan and act, followed by GenAI and machine-learning engineering. Classic data-scientist and data-engineer postings are growing far more slowly. The market is mid-heavy, with roughly 78 percent of AI roles at mid-level and only about 3 percent senior, so the scarce commodity is proven senior talent that can lead an agent or model into production.
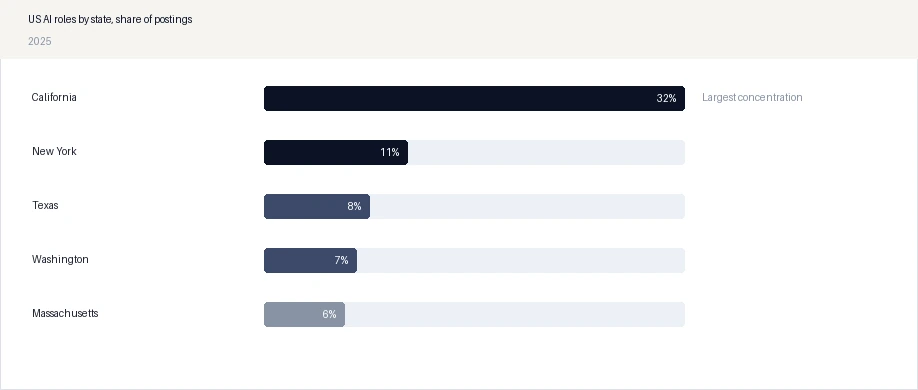
Supply is concentrated and slow to move. The United States holds around 1.2 million AI professionals, the largest and densest pool, but AI roles cluster in a handful of states, with California alone near a third of them. Only about 13 percent of AI roles are remote, which keeps the effective pool for any one employer smaller than the national totals suggest.
The first jobs AI automates sit inside AI and data work itself. The manual, repetitive parts, hand-labeling training data, rebuilding the same dashboards and running notebook exploration by hand, are being absorbed by foundation models, auto-labeling and GenAI analytics. The work is moving toward the engineers who build and ship models and agents, and away from the roles that only prepared or reported on data.
| Declining role | Why it is shrinking | What replaces it |
|---|---|---|
| Manual data-labeling / annotation specialist | Auto-labeling and synthetic data remove most hand annotation. | Data-centric ML engineers who curate and evaluate training sets. |
| Dashboard / BI-only data analyst | GenAI analytics answers routine questions in natural language. | Analytics engineers and AI product analysts who model and ship. |
| Rule-based / manual model builder | Foundation models and AutoML cover standard prediction tasks. | GenAI and ML engineers who fine-tune and deploy models. |
| Notebook-only junior data scientist | Manual exploration and one-off scripts do not reach production. | ML engineers who own models and agents in production. |
The decline is of the manual, prepare-and-report version of these roles. Reskilling routes from analysis and labeling into ML engineering, GenAI and agentic development are set out in the full report. Source: LinkedIn; McKinsey; Talenbrium classification
US pay leads by a wide margin. A machine-learning engineer earns around USD 165,000 at median base and a research scientist around USD 200,000 before equity, which for GenAI specialists can push total compensation past USD 300,000. Germany and the United Kingdom pay materially less in base terms for the same roles, though senior specialists in London, Munich and Berlin close part of the gap.
The table sets year-over-year demand and median base pay for each designation across the three markets, so an offer can be calibrated by role and country.
| Role | Demand, YoY | US median | Germany median | UK median |
|---|---|---|---|---|
| AI Agent / Agentic AI Engineer | +280% | $195,000 | €98,000 | £92,000 |
| LLM / GenAI Engineer | +45% | $190,000 | €95,000 | £90,000 |
| ML / AI Research Scientist | +22% | $200,000 | €95,000 | £95,000 |
| AI Solutions Architect | +20% | $180,000 | €100,000 | £95,000 |
| AI Product Manager | +18% | $175,000 | €90,000 | £85,000 |
| ML Engineer | +42% | $165,000 | €85,000 | £80,000 |
| MLOps Engineer | +30% | $160,000 | €90,000 | £85,000 |
| Data Engineer (ML) | +12% | $140,000 | €72,000 | £68,000 |
| Data Scientist | +10% | $135,000 | €70,000 | £65,000 |
Median base pay, mid-level, in local currency. US figures anchored to levels.fyi and market bands; Germany and UK to 2025-2026 country data. GenAI specialists reach USD 300,000-plus in total compensation with equity. Demand is the Talenbrium year-over-year posting change. Source: Talenbrium posting intelligence and compensation model; levels.fyi; Optiveum 2025-2026
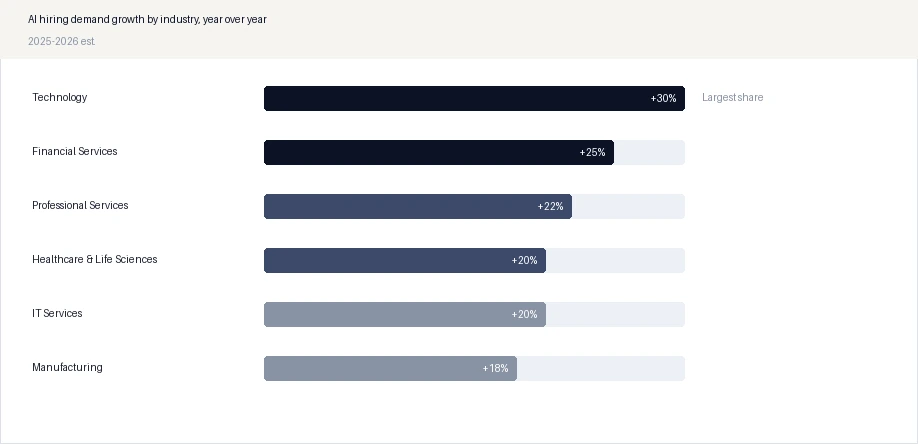
Technology firms post the largest share of AI roles, close to half, but the sharpest relative growth is spreading into finance, professional services and manufacturing as those sectors move from pilots to production. Financial services already accounts for about one in seven AI postings.
The pattern holds at the role level. GenAI and MLOps rise fastest as employers shift from proving a model works to running it reliably, which is where the mid-heavy market runs shortest of proven talent.
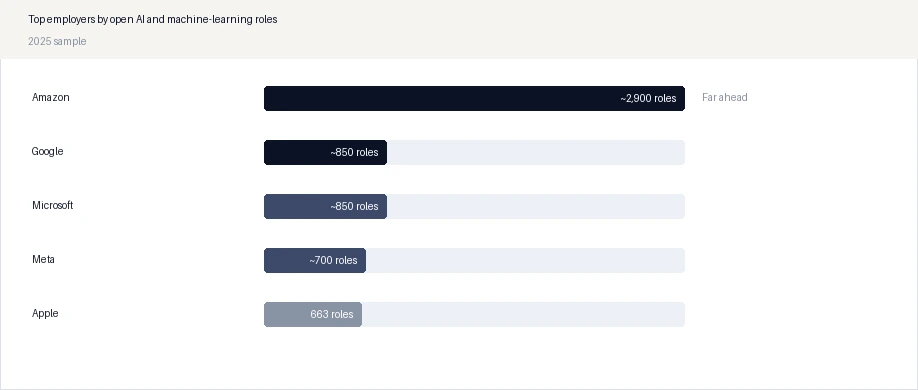
Hiring is concentrated among the largest technology firms. Amazon leads by a wide margin with around 2,900 open AI roles, several times its nearest rival, followed by Google, Microsoft and Meta in the several-hundred range each, with Apple near 660. These employers set the pay ceiling and pull the deepest senior talent.
For any other employer this is competitive intelligence. When Amazon and the large platforms hire AI talent at this scale, a bank or manufacturer competing for the same people has to win on the problem, on location or on speed rather than on brand.
AI roles concentrate geographically. Within the United States, California accounts for about 32 percent of AI roles, with New York, Texas and Washington together holding another quarter. Outside the US, the United Kingdom runs the densest AI pool in Europe around London, Cambridge and Oxford, while Germany is the largest EU hiring market with senior machine-learning pay above EUR 100,000.
Concentration is a demand signal as much as a supply one. A dense metro has more employers competing for the same engineers, so hiring in California or London means competing directly with the platforms, while a thinner market means a smaller pool to draw from at all.
Three forces hold the AI shortage in place. Demand has shifted from experimentation to production, which needs engineers who can run models reliably rather than only build them. The talent pipeline is mid-heavy, with few proven senior people and a long lead time to grow them. And the roles concentrate in a small number of metros, which deepens competition where the work already happens. None of these clears inside a single hiring cycle.
The report turns the role-level pattern into an AI hiring and reskilling plan. It names the demand, the pay and the supply for each designation across the United States, Germany and the United Kingdom.
Year-over-year demand and median pay for every AI designation across the US, Germany and the UK.
Median and senior pay by role in USD, EUR and GBP, including the specialist premium.
Full employer league table of who hires the most, by role and market.
Country and metro talent depth mapped to competition and pay.
Shortest reskilling routes into each role, with cost and duration.
Cost comparison of hiring, contracting and internal reskilling by role.
Projected demand and time-to-fill by role, from live pipeline data.
Every exhibit supplied as an Excel workbook.
The report is built on Talenbrium's four-layer data method: real-time job-posting intelligence, a proprietary skills taxonomy of more than 8,000 skills, employer hiring tracking, and a quarterly Workforce Pulse Survey, triangulated against external benchmarks. Role demand comes from posting analysis. Pay is drawn from posted and surveyed compensation and market salary data, and is reported at median and at the 90th percentile.

Customise the study to your target geography, role, skill cluster, or benchmark set, or request a sample before you proceed.