
Factory modernization is funded. Reshoring incentives, the CHIPS and Science Act and European reindustrialization money have put automation capital in place, and industrial robot installations have doubled over the past decade on International Federation of Robotics figures. The work itself has changed with the money. Hand-written ladder logic, teach-pendant robot setup and reactive break-fix maintenance are being written out of the plant by model-based control, offline simulation and predictive maintenance. The hiring has moved to a different set of roles: robotics and automation engineers, AI automation architects, machine vision engineers, industrial data engineers and operational-technology security engineers. Each of these is posting at double-digit growth while the supply pipeline stays close to flat.
This report treats these forward-facing roles as the unit of analysis. It profiles each designation, sets demand against supply, names the roles being automated away and what replaces them, benchmarks pay across the United States, Germany and the United Kingdom, shows where the openings concentrate, and names the employers hiring the most.
Automation is not one job. Ten designations carry the work, and they fall into three forward-facing layers: the AI, robotics and vision engineers who design the line, the data, security and reliability specialists who run it, and the integration and mechatronics roles that tie it together. Naming them precisely matters, because demand, pay and supply differ sharply across them.
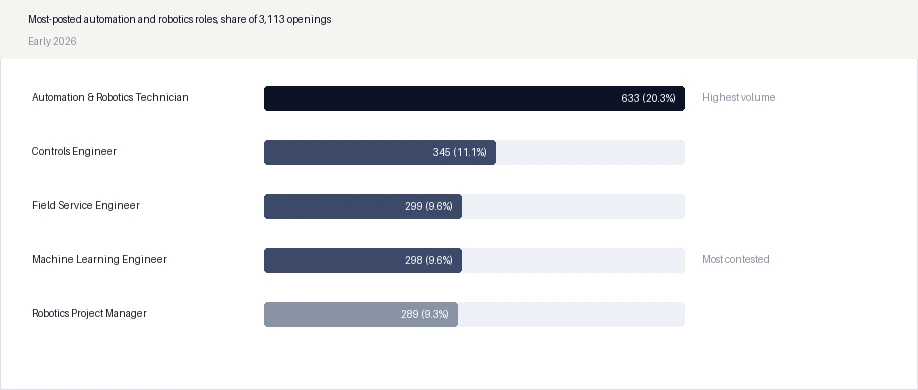
A job-posting analysis of more than 3,100 active robotics and automation openings in early 2026 still shows technicians at the top by raw volume, with automation and robotics technicians at 633 openings, controls engineers at 345 and field service engineers at 299. That volume is real, but part of it is the manual, break-fix version of the work that predictive maintenance and remote diagnostics are steadily removing. The faster-growing and harder-to-fill demand is for machine learning engineers, machine vision engineers and AI automation architects, which post fewer openings but carry the highest competition for each seat.
Supply does not match. The US Bureau of Labor Statistics counts about 158,800 robotics engineers in 2024, with roughly 9,300 openings a year, and the feeder pipelines of electrical, mechatronics and controls programs are close to flat. A funded line cannot wait two years for a graduate cohort, so the gap shows up as time-to-fill, which for controls and automation engineers now runs near 68 days and has lengthened over the past year.
Automation is now automating its own manual work. The routine programming and reactive-maintenance jobs that filled a plant a decade ago are being written out by model-based control, offline simulation, cobots and condition monitoring. The function is not shrinking. It is moving up-value, from hand-coding and break-fix toward AI, vision and industrial data, and the engineers who make that move are the ones in demand.
| Declining role | Why it is shrinking | What replaces it |
|---|---|---|
| Manual PLC / ladder-logic programmer | Model-based design and AI-assisted tools now generate and test control logic. | Controls engineers who work in simulation and model-based design. |
| Teach-pendant robot programmer | Offline simulation and AI vision-guided robots remove manual point-teaching. | Robotics engineers who program cells inside a digital twin. |
| Reactive break-fix maintenance technician | Condition monitoring predicts failures before the line stops. | Predictive maintenance engineers using IIoT and machine learning. |
| Manual machine operator / line tender | Cobots and autonomous cells run the repetitive tending work. | Automation technicians who supervise and maintain the cells. |
The decline is of the manual, routine version of these roles, not of automation work itself. Reskilling routes from manual programming and maintenance into vision, controls and predictive maintenance are set out in the full report. Source: CSG Talent 2026; IFR World Robotics; Talenbrium classification
Pay tracks scarcity, and it varies by market. US employers pay the most for these roles. An operational-technology security engineer clears about USD 138,000 at median and USD 155,000 or more at senior level before any clearance premium. Germany and the United Kingdom pay less for the same mainstream roles, though specialist deep-tech robotics-control engineers reach far higher, from EUR 120,000 to EUR 180,000 in Germany and GBP 140,000 to GBP 220,000 in the UK at senior level.
The table sets year-over-year demand, median base pay in each market, and estimated US openings for every designation, so an offer can be calibrated by role and country rather than against a single national average.
| Automation role | Demand, YoY | US median | Germany median | UK median | Est. US openings |
|---|---|---|---|---|---|
| OT / ICS Security Engineer | +41% | $138,000 | €85,000 | £68,000 | 6,500 |
| Robotics / Automation Engineer | +33% | $101,000 | €72,000 | £54,000 | 9,300 |
| Automation Systems Integrator | +29% | $130,000 | €78,000 | £60,000 | 5,200 |
| MES / IIoT Engineer | +27% | $122,000 | €75,000 | £58,000 | 4,100 |
| Machine Vision Engineer | +26% | $118,000 | €74,000 | £56,000 | 2,800 |
| Controls Engineer | +22% | $103,000 | €70,000 | £52,000 | 14,600 |
| Predictive Maintenance Engineer | +30% | $122,000 | €72,000 | £58,000 | 7,400 |
| Mechatronics Engineer | +18% | $95,000 | €66,000 | £48,000 | 5,400 |
Median base pay, mid-level. US bands drawn from 2026 industrial-automation salary benchmarks; Germany and UK from European market data. Robotics-engineer openings and base employment are US Bureau of Labor Statistics figures for 2024; other openings are Talenbrium estimates. Senior deep-tech robotics-control specialists reach EUR 120,000 to 180,000 in Germany and GBP 140,000 to 220,000 in the UK. Source: Talenbrium posting intelligence and compensation model; US Bureau of Labor Statistics, 2024; European robotics salary benchmarks, 2026
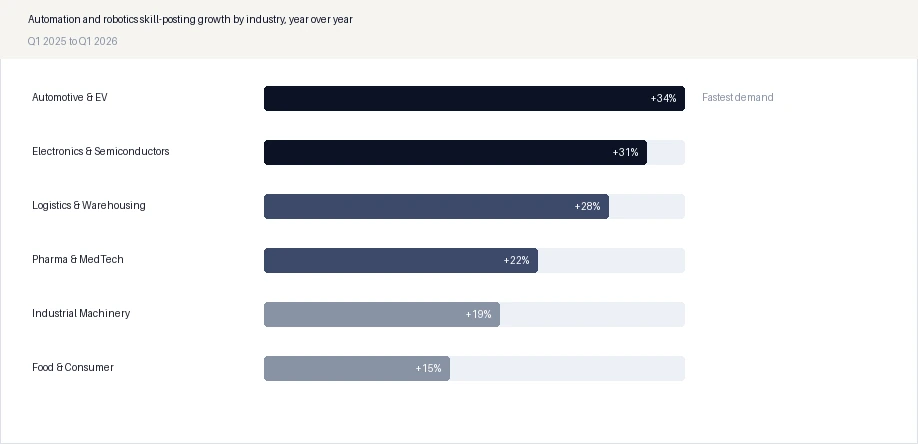
Demand is not spread evenly. It concentrates in the industries automating hardest. Automotive and electric-vehicle plants lead, with automation and robotics postings up 34 percent year over year, followed by electronics and semiconductor fabrication at 31 percent and warehouse logistics at 28 percent. The same push shows at the role level, where operational-technology security and robotics engineering rise fastest.
The demand-push ratio, the number of open roles for each available qualified candidate, sits above two to one for the engineering designations and higher still for operational-technology security. A ratio above one means employers compete for the same people, which lengthens hiring and lifts pay.
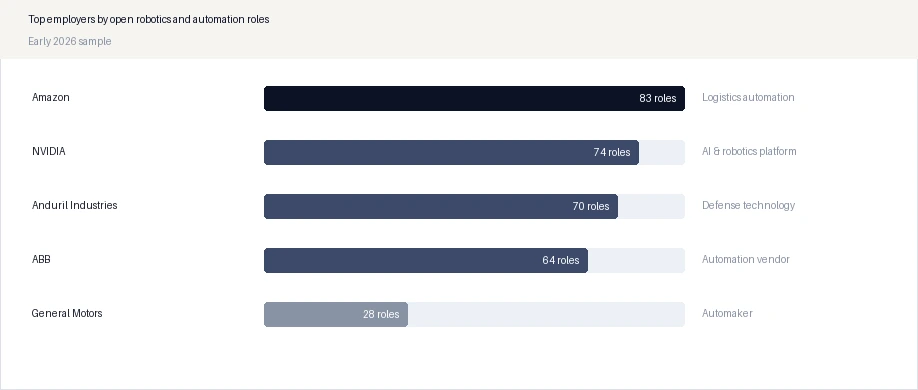
Hiring is concentrated among a handful of employers. In the early-2026 posting sample, Amazon led with 83 open robotics roles, followed by NVIDIA at 74, Anduril Industries at 70 and ABB at 64. General Motors rounded out the top five at 28. These five accounted for more than one in ten of all tracked openings. The mix is telling: a logistics giant, a chip and AI platform, a defense-technology firm, an industrial-automation vendor and an automaker. It shows how far automation hiring now reaches beyond traditional manufacturing.
For a hiring team this is competitive intelligence. When Amazon and NVIDIA pull robotics and machine-learning talent at this scale, a mid-market manufacturer competing for the same candidates has to win on role design, location or speed rather than on brand.
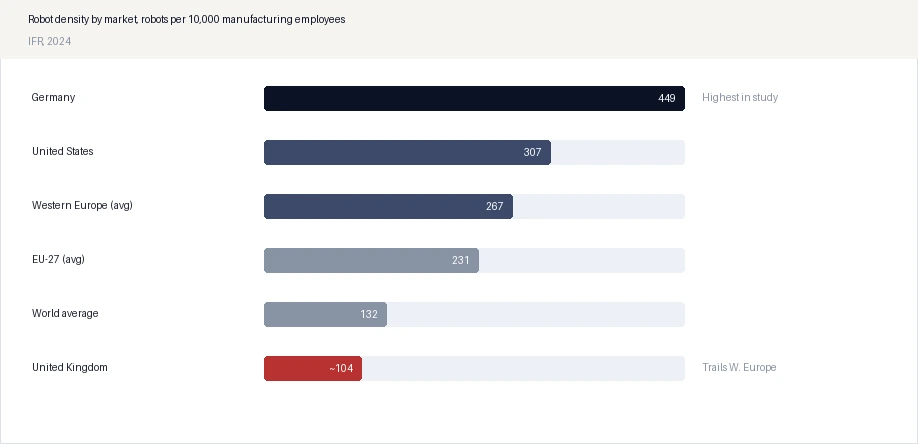
Where robots are dense, automation talent is both deeper and more contested. Germany runs the highest robot density of any market in this study, at 449 robots per 10,000 manufacturing employees, well above the Western European average of 267. The United States sits at 307, above the world average of 132. The United Kingdom trails the Western European field, which is why UK employers face a thinner domestic pool and lean harder on reskilling and inbound hiring.
Density is a demand signal as much as a supply one. A dense market has more installed systems to maintain and more employers competing for the same engineers, so Germany pairs deep capability with intense competition. Lower-density markets face scarcity of a different kind, too few specialists to modernize at all.
Three structural forces hold the shortage in place. Reshoring and industrial policy have pulled production back to the US and Europe faster than the workforce can be trained. The convergence of information and operational technology has turned single-discipline jobs into hybrid ones that ask for controls, data and security in one person. And the education pipeline for electrical, mechatronics and controls talent has stayed flat while demand climbed. None of these reverses inside a hiring cycle, which is why the shortage is structural rather than a swing in the market.
The report turns the role-level pattern into a hiring and reskilling plan. It names the demand, the pay and the supply for each designation across the United States, Germany and the United Kingdom, and it sets out where to hire, where to reskill and where to relocate.
Year-over-year demand, median pay and annual openings for all ten automation designations, split across the US, Germany and the UK.
Median and senior pay by role in USD, EUR and GBP, including the deep-tech specialist premium.
Full employer league table of who hires the most, by role and by market.
Country and metro density mapped to the depth and contest of the local talent pool.
The shortest reskilling routes from maintenance and electrical trades into each role, with cost and duration.
Cost comparison of hiring, contracting and internal reskilling by role.
Projected demand and time-to-fill by role, built from live pipeline data.
Every exhibit supplied as an Excel workbook for your own modelling.
The report is built on Talenbrium's four-layer data method: real-time job-posting intelligence, a proprietary skills taxonomy of more than 8,000 skills, employer hiring tracking, and a quarterly Workforce Pulse Survey, triangulated against external benchmarks. Role demand comes from posting analysis. Robot density figures are from the International Federation of Robotics World Robotics 2025 report. Employment and openings for robotics engineers are from the US Bureau of Labor Statistics. Pay is drawn from posted and surveyed compensation and 2026 automation salary benchmarks, and is reported at median and at the 90th percentile.

Customise the study to your target geography, role, skill cluster, or benchmark set, or request a sample before you proceed.